

Liquid-chromatography coupled to mass spectrometry has become the most widespread tool for simultaenous detection of 100’s or 1,000’s of molecules in biological systems [1]. In untargeted metabolomics, a persistent challenge is selecting the right liquid chromatography (LC) method to couple to the mass spectrometer. The challenge lies in knowing how to select the right LC method or how to approach method development to have the potential to detect all metabolites in a complex mixture.
Traditional approaches to optimizing chromatographic separations rely on a few assumptions that an -omics analyst violates on a daily basis: i) We don’t know what we’re looking for, so we won’t know when the first and last peak elute. ii) To achieve retention of polar metabolites, we typically need to use HILIC columns, whereas guidelines are usually established for C18 columns. Additionally, many of the molecules we’re trying to analyze are chemically so similar that they might not separate at all in the LC. Most tutorials assume your LC is coupled to a UV detector, where no orthogonal separation is taking place, and they must focus on separating all compounds in the LC. In LC/MS, we optimize for good enough LC, not perfect LC. But what’s good enough?
Good enough chromatography
In this post, we discuss what good enough chromatography should look like and how to approach the daunting task of method development. In many ways, this text serves as an -omics extension of LCGC North America’s “Initiating Method Development with Scouting Gradients—Where to Begin and How to Proceed?” [2] and “A Simple Approach to Performance Optimization in HPLC and Its Application in Ultrafast Separation Development” [3]. My objective in optimizing chromatographic runs is to maximize the number of metabolites detected while finding a good trade-off between analysis time and separation between molecules.
As a practical note, I assume the starting point for any HILIC optimization is a scouting gradient, which is a linear gradient starting roughly at 5% water / 95% acetonitrile and ending with 95% water / 5% acetonitrile, buffered to pH 2, pH 7, or pH 9 with formate and ammonia. The slope of the linear separation is set to scale with column length; I usually start from ~10% per minute for a 100 mm column with a 400 μL/min flow rate.
Taking advantage of chemical similarities between metabolites
In optimizing chromatographic methods, it is helpful to realize that while metabolites are not macromolecules built from repeating units like nucleic acids or proteins, they tend to span chemical classes in terms of structure or functional groups. Some of the largest groups are dicarboxylic acids, nucleotide-containing molecules, amino acids, sugars, and sugar phosphates.
All metabolites belonging to any of these classes tend to behave similarly in a given chromatographic separation. In other words: if your column binds one dicarboxylic acid, it likely binds all of them. When optimizing a new chromatographic method, it’s useful to create extracted ion chromatograms of representative member molecules of each of these groups and look at the retention time as well as the separation of isomers. Most peak viewing software allows to save these as layouts for convenience. I’m providing an example set of metabolites to pay attention to here (link to a Google spreadsheet).
Usually, within each of these groups, retention times are very similar, but between the groups, there might be larger gaps in retention time. The first thing to look at is simply how many metabolites you can detect in each class. This is usually something you can’t change, so if you don’t see peaks for metabolites of interest in a standard scouting gradient, it’s advisable to move on and try another column.
Optimizing start and end conditions
If you’re happy with the metabolite coverage observed for a column, you can move on to optimizing the start and end conditions as well as separation. Alternatively, instead of looking only at known metabolites, you can take advantage of untargeted peak-picking algorithms at this stage. Doing so essentially amplifies the effect you’d see when looking at targeted layouts with known metabolites. If you plotted it, it would look like this:
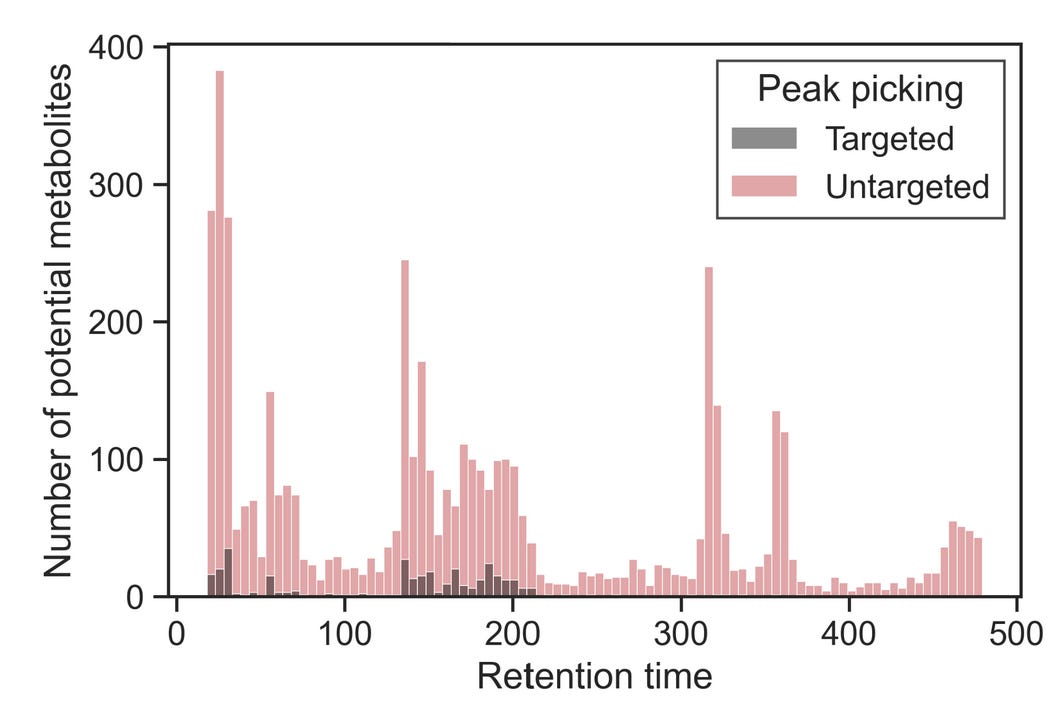
Using these layouts of known metabolites, pay attention to the retention times. At what time does the first “hotspot” occur? How about the last one? If you sufficiently covered the chemical diversity of the metabolome with these layouts, you’d be identifying the -omics equivalent of the first and the last peak.
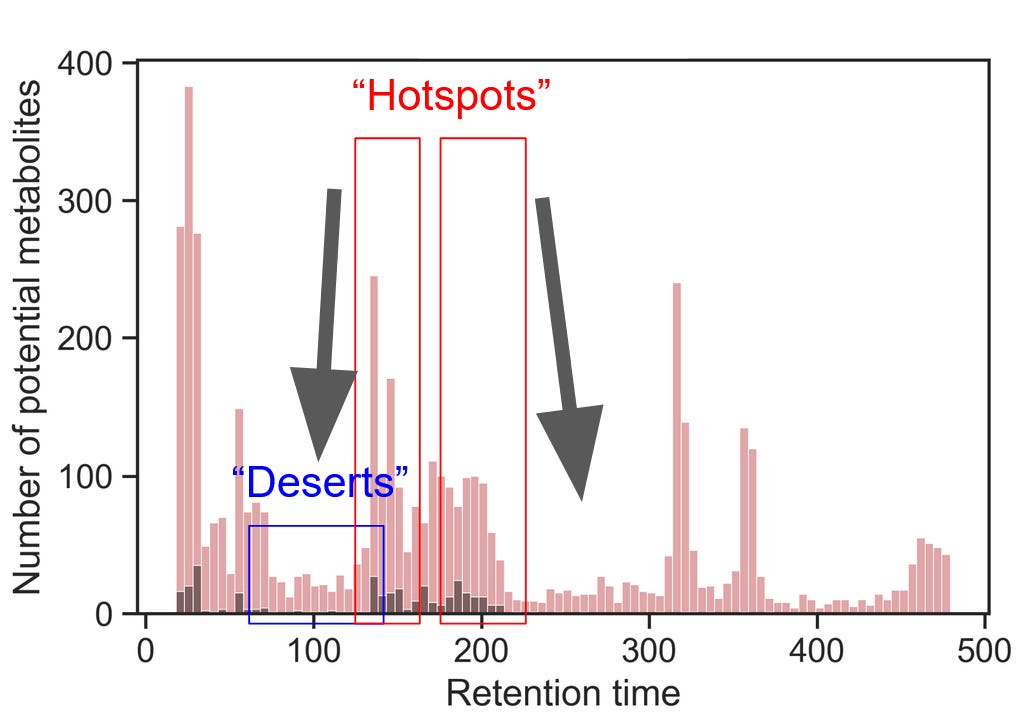
You can modify your mobile phases to start at the ratio of roughly one minute before the first hotspot and end at the ratio of one minute after. In the example gradient above, most known metabolites elute between 150 and 200 seconds, with three hotspots within that run. Untargeted peak picking helps reveal that most compounds elute at ~320, ~360, and ~470 seconds. In this case, I would keep the starting and ending conditions as they are, but reasonable alternative cases could be made for limiting the run to include elution conditions starting at 100 and ending at 320 or 360 seconds, which would considerably increase the throughput of the analysis.
Optimizing separation within metabolite clusters
Once you’ve determined the boundaries of the chromatographic gradient, it’s time to optimize the separation within each cluster of metabolites. Effectively, we try to move metabolites from the “hotspots” to the spaces in between, like so:
There are two ways in which an analyst can manipulate the retention of their analytes:
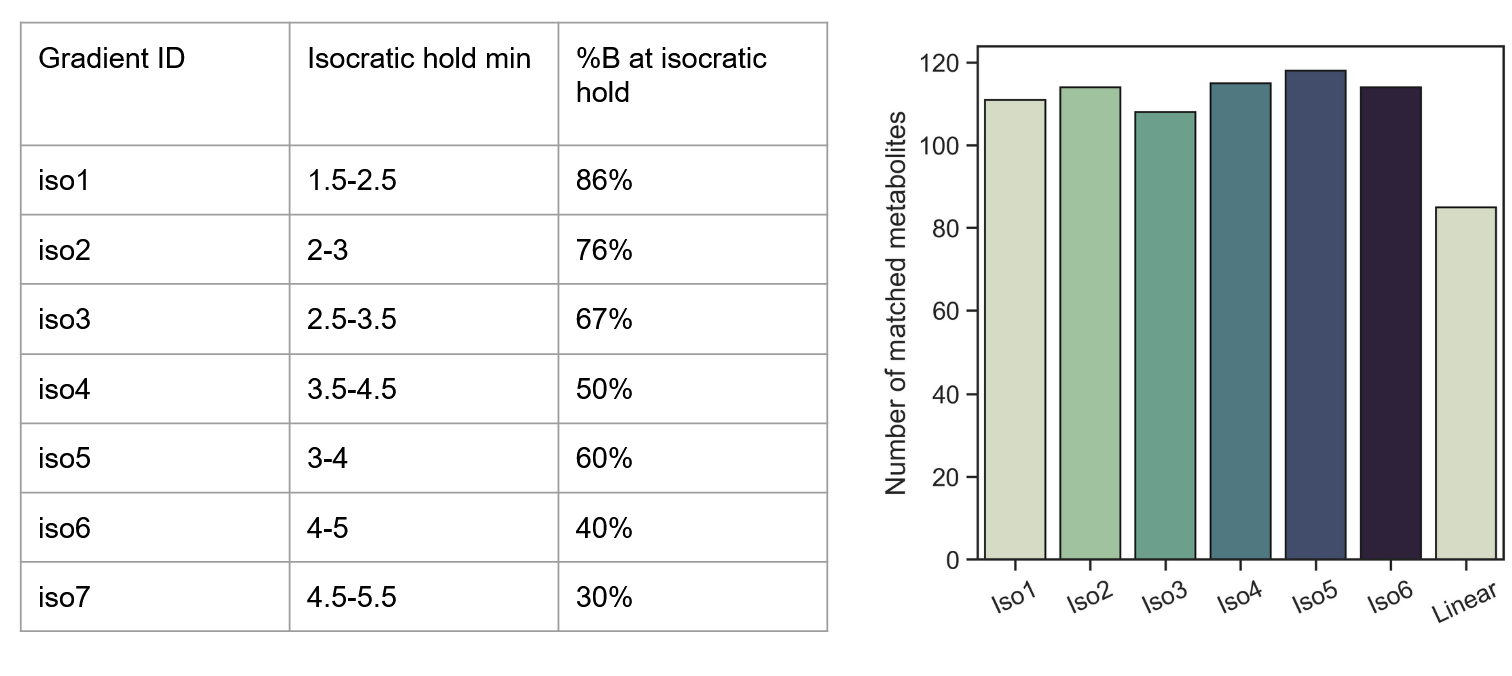
Create isocratic holds within the hotspot
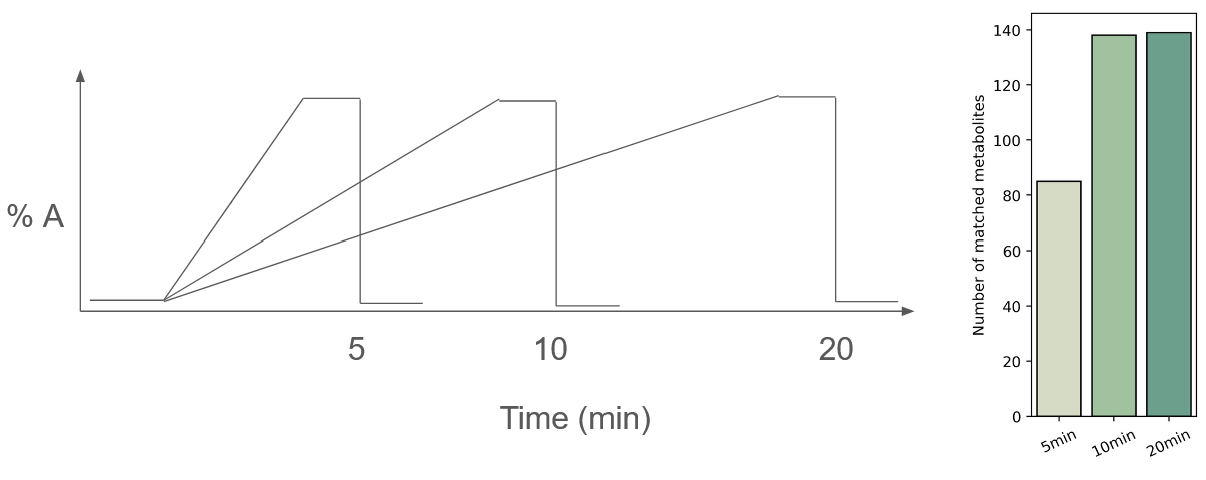
Lower the overall slope of the gradient
This seems simple enough, but it quickly becomes a combinatorial nightmare, considering there are at least five reasonable options for each of the two points. It’d be better to just have to tweak one parameter. I tested the effect of each of the two methods separately so you won’t have to.
Effect of isocratic holds on metabolite detection
This approach was extremely promising—evening out every hotspot via a 1-minute isocratic hold increased the number of metabolites detected by ~30%! Presumably, this could be further improved upon by running combinations of isocratic holds.
Effect of gradient slope on metabolite recovery
In the second approach, I tested the effect of gradient slope on the number of metabolites recovered. You might find the results surprising: I observed no improvement upon the starting condition (10 min run)! This is because the hotspots are the limiting factor for metabolite detection, and running a flatter slope effectively just moves these metabolite clusters around.
Final thoughts
To summarize the experiments and reasoning in this post, I recommend the following order of operations when optimizing chromatographic separations for untargeted LC/MS small molecule analysis:
Start with a simple scouting gradient that exploits the entire elution range of your column.
Using extracted ion chromatograms of representative metabolites, determine if the overall coverage is acceptable. If not, explore other column options.
Determine start and end conditions for your chromatography based on eluting metabolite clusters.
Perform 3–5 runs with different gradient slopes (e.g., 2%, 5%, 10%, 13%, 16%). Using untargeted metabolite detection tools (i.e., spectral matching), determine the highest slope that recovers the maximum number of metabolites.
Using untargeted peak picking and your layouts of representative metabolites, identify where metabolite deserts and hotspots are.
Implement isocratic holds at the metabolite clusters, either individually or in combinations.
This workflow will lead to an efficient separation and good enough chromatography for most metabolomics applications.
References
[1] Liquid chromatography–mass spectrometry. Wikipedia. https://en.wikipedia.org/wiki/Liquid_chromatography%E2%80%93mass_spectrometry. Cited on 2025/03/15.
[2] Stoll, Dwight R. Initiating Method Development with Scouting Gradients—Where to Begin and How to Proceed? LCGC North America. https://www.chromatographyonline.com/view/initiating-method-development-with-scouting-gradients-where-to-begin-and-how-to-proceed-. Cited on 2025/03/15
[3] Carr, Peter W. A Simple Approach to Performance Optimization in HPLC and Its Application in Ultrafast Separation Development. LCGC North America. https://www.chromatographyonline.com/view/simple-approach-performance-optimization-hplc-and-its-application-ultrafast-separation-development. Cited on 2025/03/15