
Identifying molecules from MS1 spectra
Master the art of turning intact mass spectrometry signals into molecules - no fragmentation needed

I remember when I first started working with mass spectrometers. It seemed almost magical to just look at a mass spectrum and immediately see the molecular formula. A lot of the time we rush into ordering expensive chemical standards or fragmentation, but it turns out a simple mass-to-charge measurement holds a surprising amount of information. In this post, we walk through the typical process of identifying compounds de novo with nothing but chemical principles and mass spectrometry data at hand.
What is mass-to-charge?
Mass-to-charge, or m/z, is the fundamental value measured by a mass spectrometer. It represents the ratio of a molecule’s mass to its charge. Because molecules analyzed in mass spectrometry carry a charge from the ionization that takes place at the interface to the instrument, what we actually measure is not the molecular weight itself, but this m/z value. Our task is to infer the (monoisotopic) mass from the m/z.
Identifying signals originating from one compound in mass spectra containing data for 1,000’s of molecules
A mass spectrometry measurement consists of ionization of molecules coupled to a continuous measurement of mass spectra. A modern, high-resolution mass spectrometer acquires m/z and intensity data for all ions that find their way from the ion source to the detector. A mass spectrum is essentially a two dimensional array with m/z values on the x axis and intensity values on the y axis. In Figure 1, mzmine is used to visualize one of the 1,000’s of spectra acquired in this specific run. While for quantification we need to analyze multiple spectra, for identification we typically only use one spectrum.
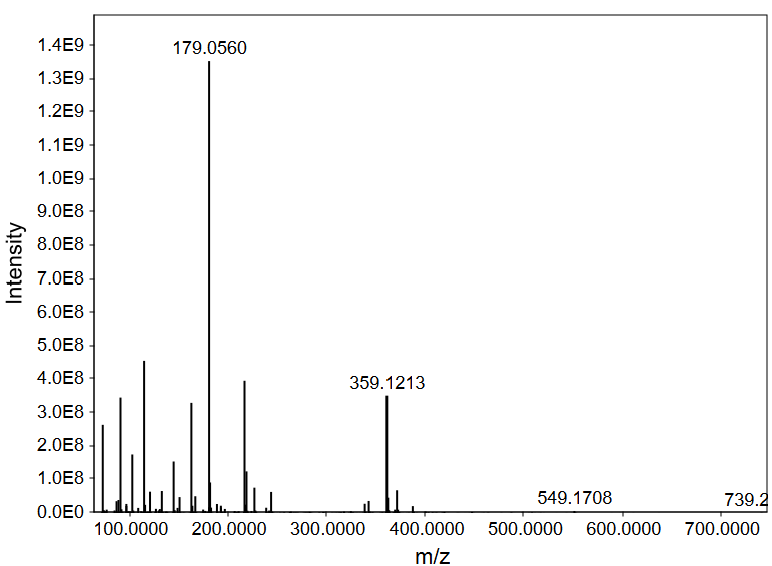
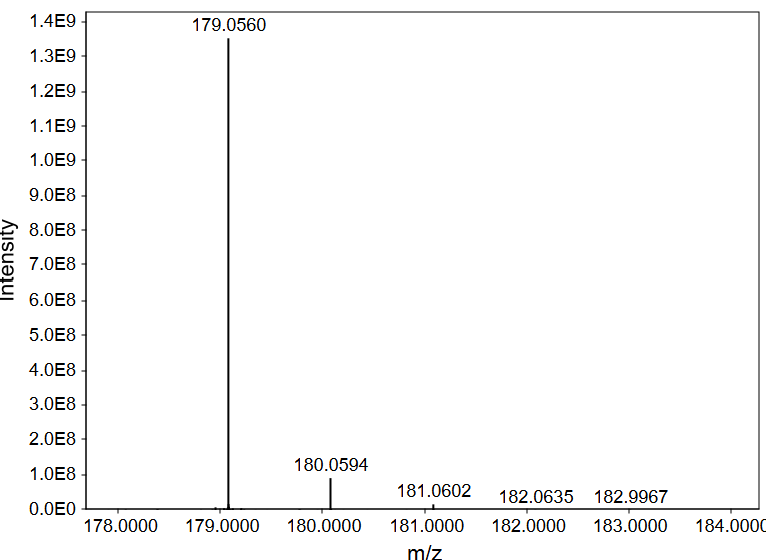
In Figure 1, we see several m/z values for relatively high abundance ions, for instance 179.0560 and 359.1213. For identifying small molecules (less than 50 carbon atoms), these are a good starting point for identifying compounds. Focusing on the strong signal at m/z 179.0560, let’s first zoom in and check out the neighboring signals (Figure 2) to see if we can detect naturally occurring isotopologues for this compound. We are going to use these isotopologue signals to infer the monoisotopic mass, charge state, and what elements are present in the molecule.
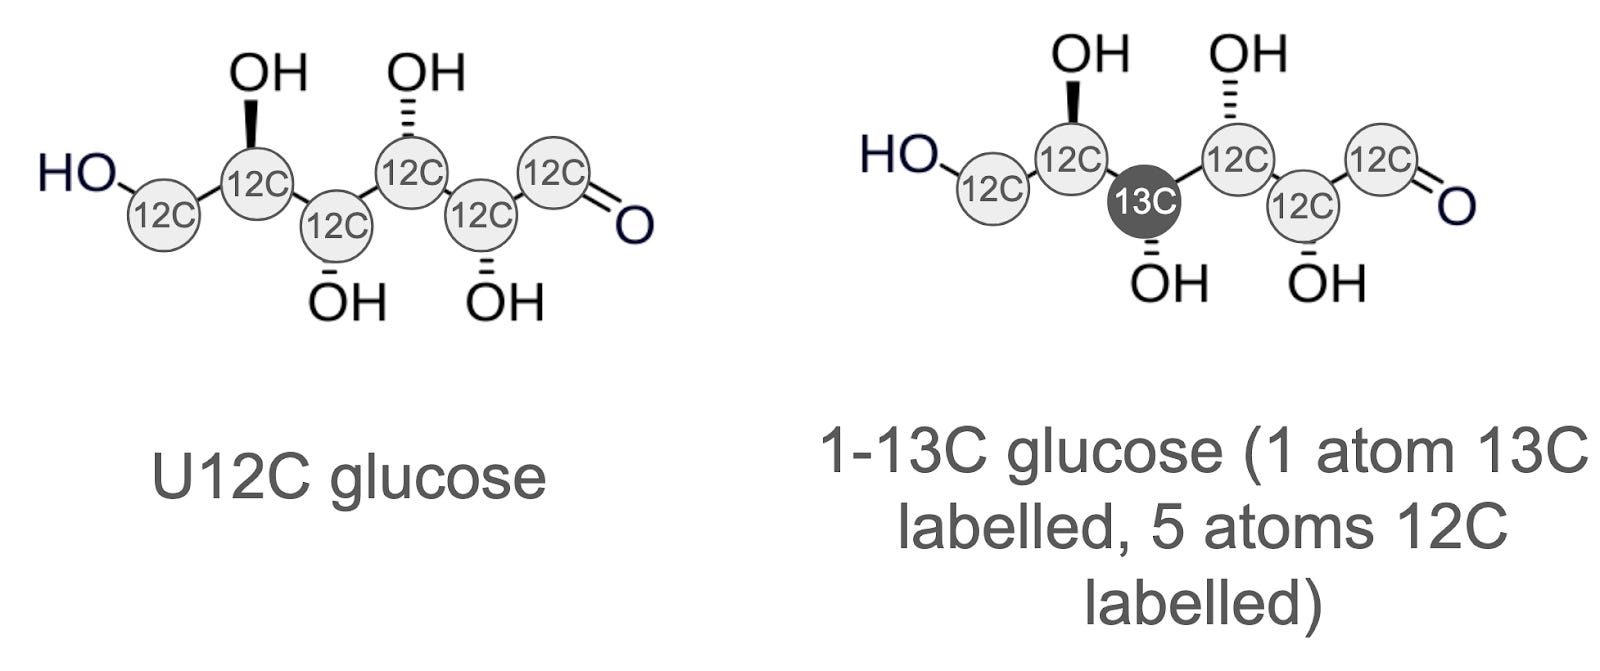
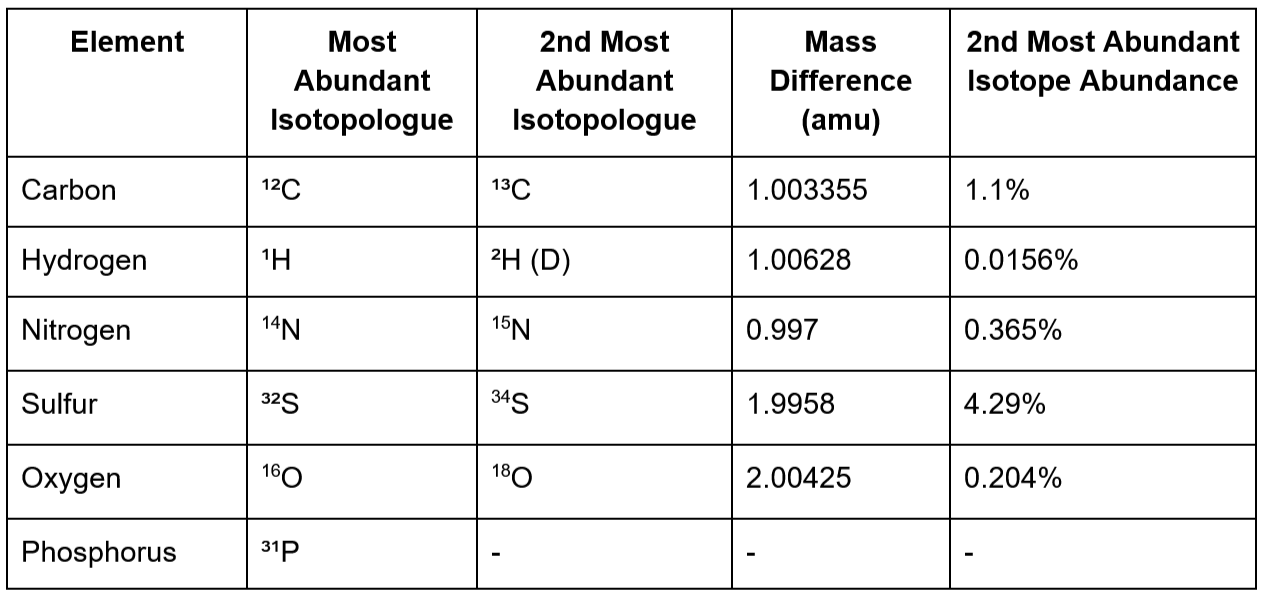
Let’s explore carbon, which is the first element we usually try to identify. Most carbon atoms are of the most abundant 12C isotope, but about 1.1% of them are 13C, which is heavier by 1.003355 Da (Figure 3). When we talk about a molecule, glucose for example, we mean a mixture of molecules that vary only in the number of neutrons the elements it’s composed of. These molecules are called “isotopologues”, and they behave practically speaking identically both biologically and chemically - not like isomers that can behave very differently. So some glucose molecules uniformly 12C labelled (U12C), some have five 12C atoms and one 13C atom, some have four 12C and two 13C atoms, etc.
Isotopologue peaks show up at predictable distances from the “main” signal, which in our case is 179.0560 (most intense signal in Figure 2). The main signal is referred to as the “M+0 peak” because it’s what we identify as the molecule + zero dalton shift. In this spectrum, we see that m/z 179.0560 is accompanied by an M+1, which is detected at 180.0594. The exact m/z difference between M+0 and M+1 is 1.0034. This is only 0.000045 Da below the expected distance between 12C and 13C (1.003355; see Table1). I feel very confident calling this m/z to be the signal for 1-13C isotopologue, while 179.0560 must originate from U-12C isotopologue.
Determining charge state
At this point, we know we’re dealing with a molecule that contains carbon, but to go further, we need to determine the charge state. This is pretty straightforward in small molecule analysis. Since we’re measuring mass-to-charge ratios, the gap between isotope peaks is divided by the charge. If the spacing between 12C and 13C is about 1.003355, the charge is +1. If the spacing were around 0.5016, the charge would be +2, and so on.
For our compound with m/z 179.0560, the charge is 1, meaning the monoisotopic mass is 180.0633 if the ion was formed via deprotonation, which is usually the case.
Estimating carbon count
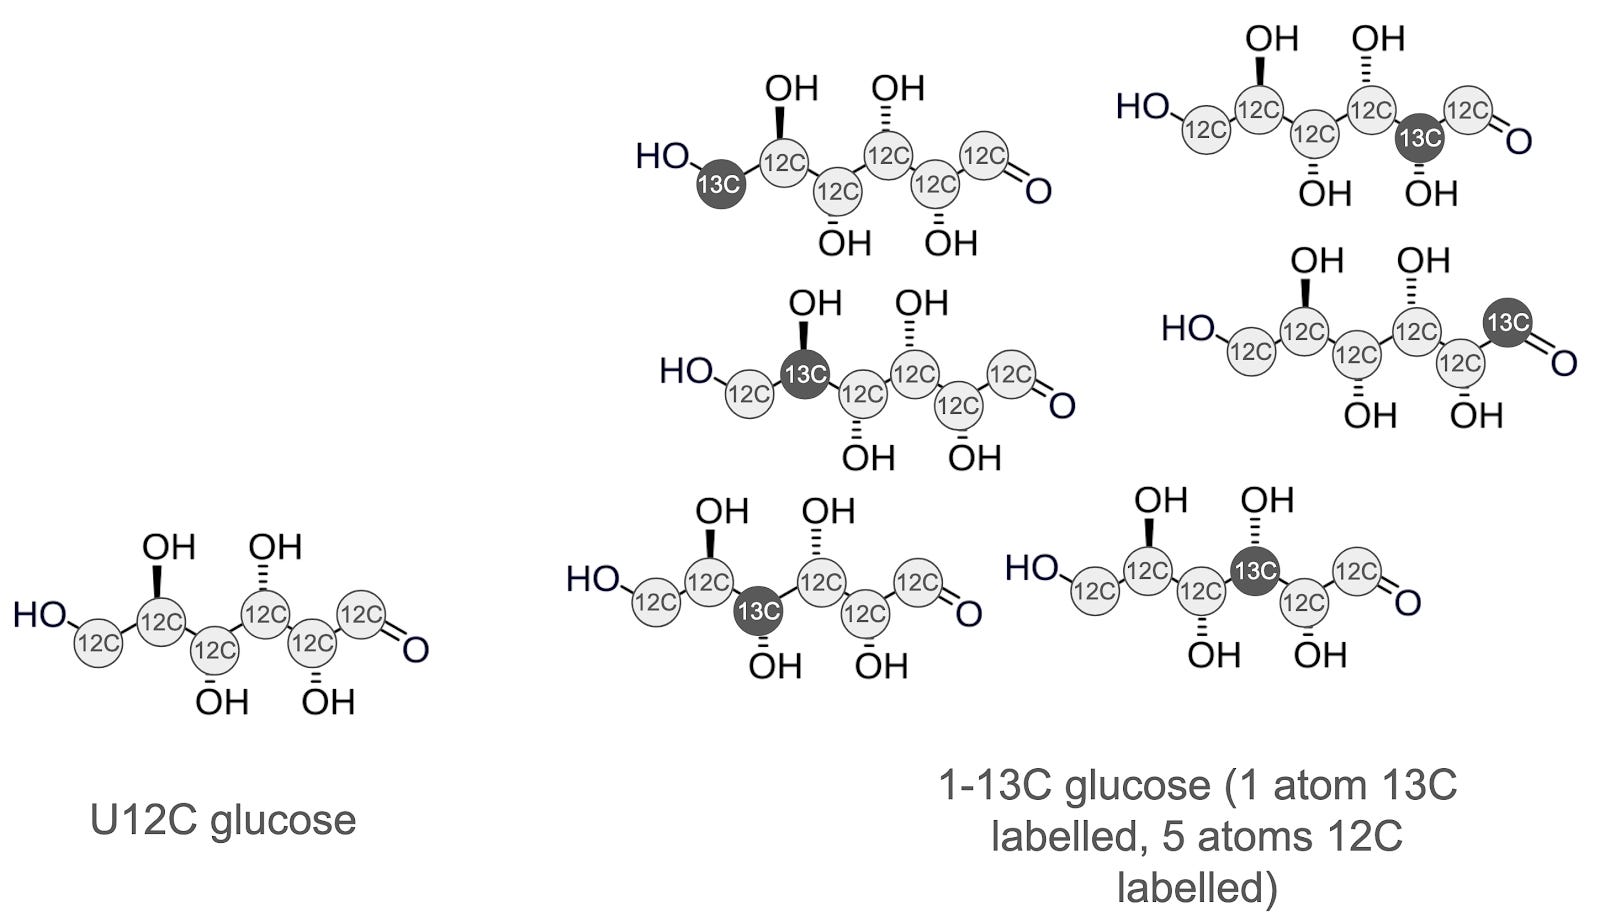
You might be thinking: Okay, cool, we can tell carbon is present, but you said we could determine how many carbon atoms there are? Turns out we can do that using the ratio of the intensity of M+0 and M+1 which can be read off the plot in Figure 2. Carbon’s natural abundance is about 1.1%, meaning that in a random sample of carbon atoms, roughly one in 100 will be 13C. So let’s say our molecule has 6 carbons. Each of those has a 1/100 chance of being 13C, which means that roughly 6% of our molecules will contain a single 13C. I find this concept a little tricky fully master - if you do too, maybe the visualization in Figure 4 will help. What this means is that the M+1 signal intensity divided by M+0 signal intensity directly gives us the number of carbon atoms in the molecule.
In our case, M+1 signal intensity is 1e7 and M+0 is 1.4e8. We can calculate the number of carbon atoms like this:
Our mystery compound has around 7 carbons.
What about other elements - is absence of evidence evidence of absence?
We’ve identified an interesting candidate molecule in a mass spectrum, and we now know it has ~7 carbon atoms. But what about other elements? Surely this isn’t just a chunk of carbon like a diamond or graphite. Indeed, there certainly are other elements in the molecule. Most atoms have other stable isotopes which we can exploit in this analysis, and they follow a pattern similar to carbon:
In our example case, the only M+1 we see is the one we identified to originate from 13C above. We don’t see any other isotopologue peaks; if we did, we’d see the deuterium signal slightly to the right of the carbon peak and the nitrogen signal slightly left of the carbon signal in Figure 2. The absence of isotopologue signals for these elements could mean one of two things:
The element isn’t present in the molecule.
OR
The isotope signal is too weak to detect.
To elaborate on point 2, hydrogen is very abundant in organic molecules, but has a very small natural abundance, making the M+1 signal for deuterated ions difficult to detect. Sulphur has a very high M+2 abundance, but biological molecules rarely come with more than one atom of sulphur. It means that the intensity of the M+1 and M+2 peaks would be low even if the molecule contained hydrogen and sulphur, potentially below the detection limit of the instrument, and look absent to us. That doesn’t mean they aren’t there - it just means we can’t see them in this particular spectrum. In practice, we usually end up with just the number of carbon atoms. In the next section, we show that the carbon count and monoisotopic mass is usually sufficient to determine the molecular formula.
Putting it all together: determining molecular formula from carbon count, charge, and monoisotopic mass
So far, we’ve identified a compound which has ~7 carbons, has a monoisotopic mass of 180.0633, and charge 1. We know it has other elements, too, but couldn’t detect direct evidence for any particular elements in the spectrum. Now I’ll reveal you one of an analytical chemists’ best party tricks: we can determine the molecular formula from these observations alone. Because we measure mass so accurately, there often is only one formula that could lead to the observed exact mass and carbon count.
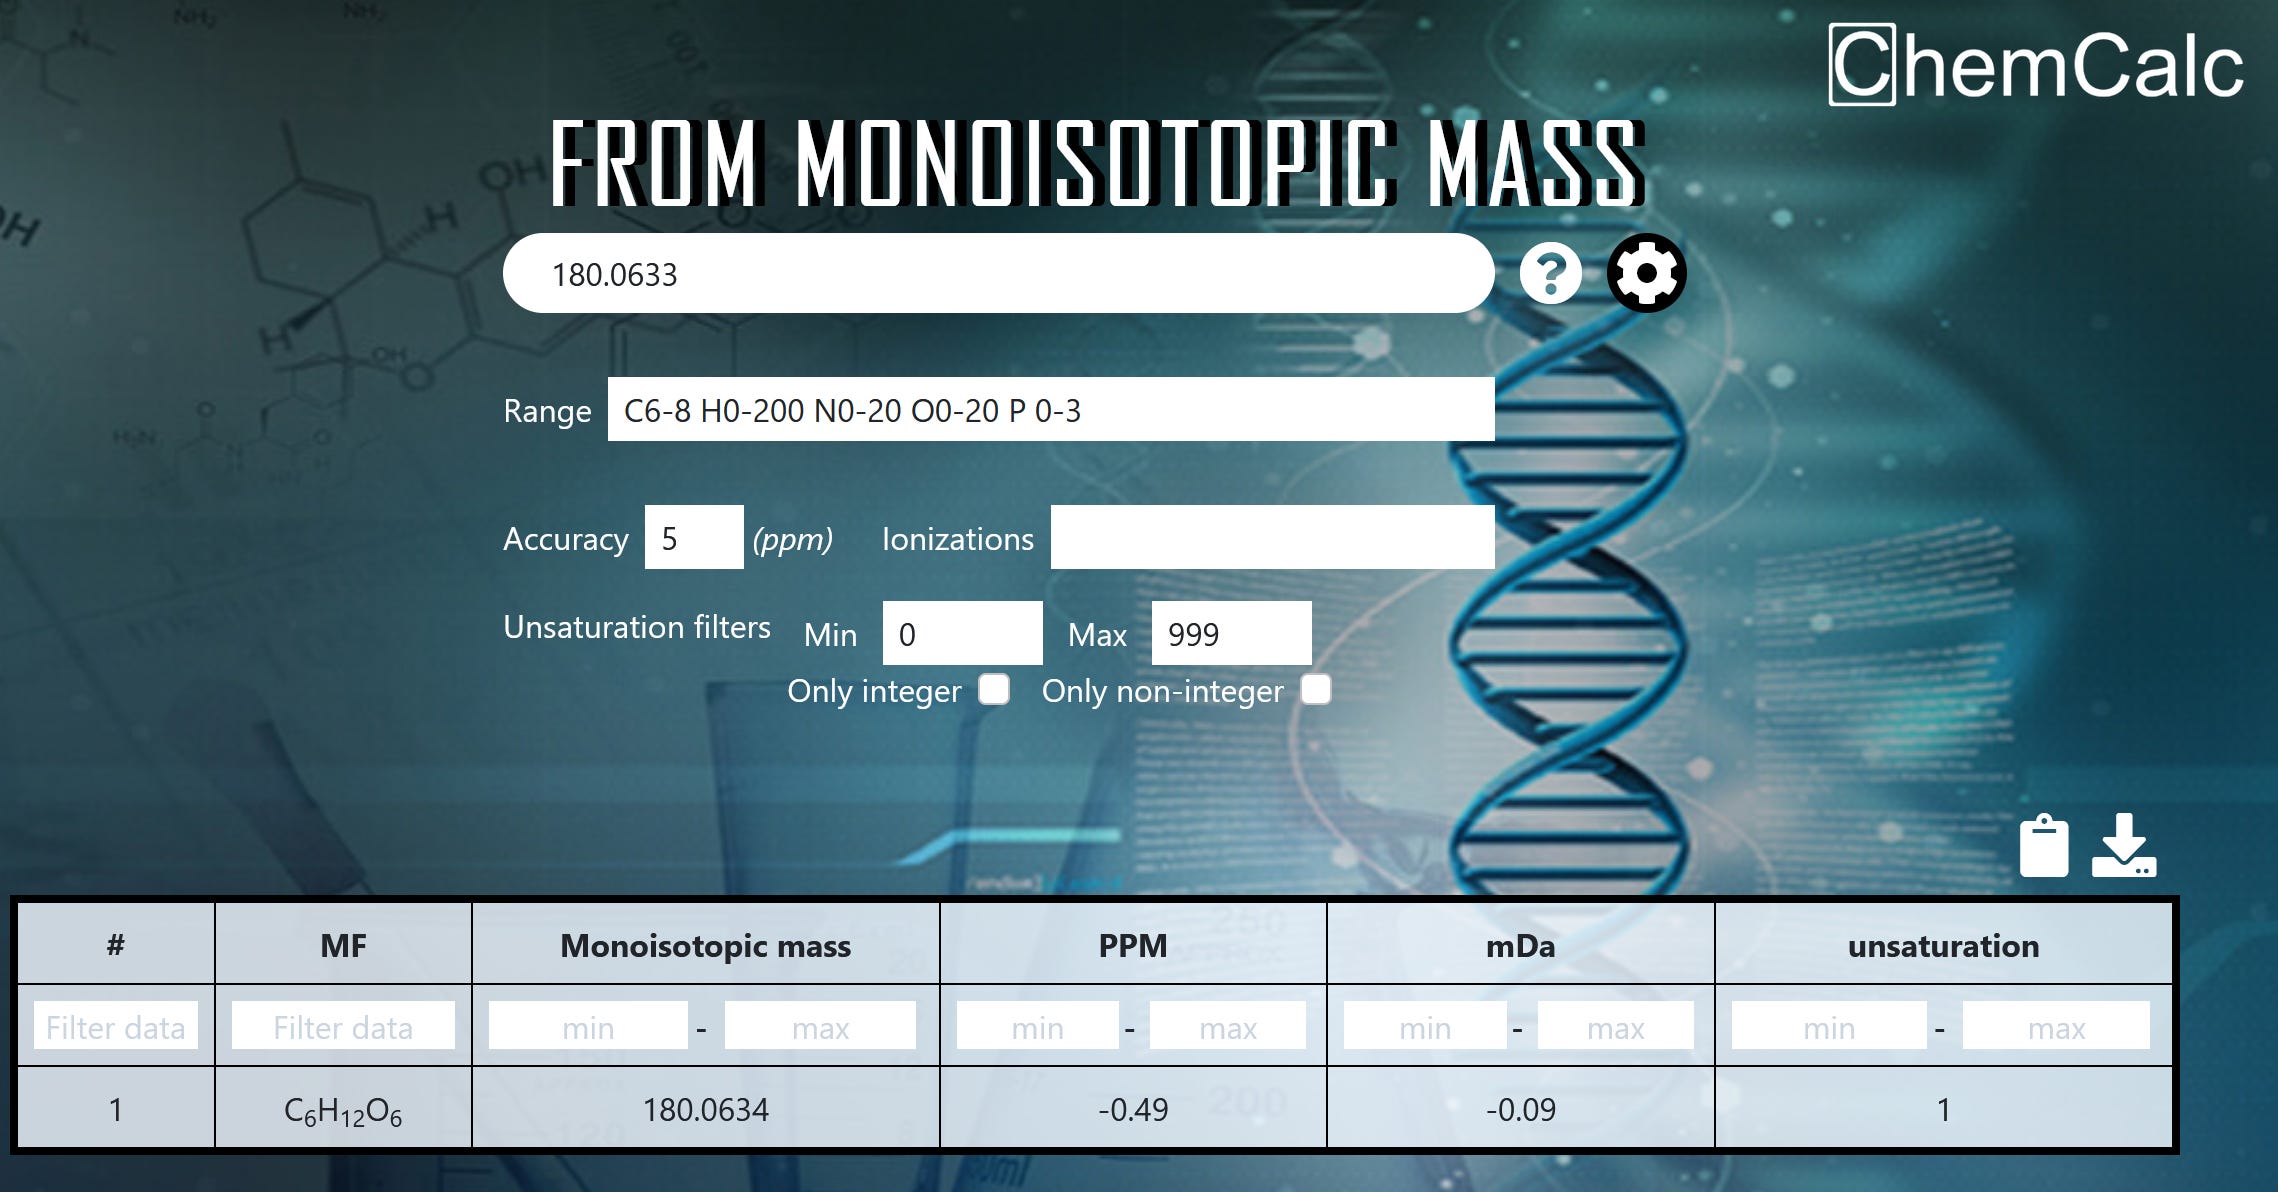
At this point, we computationally test different combinations of allowed atoms to see which ones match both the carbon count and the exact mass. For allowable atoms, we use some basic constraints from biology; it’s likely the molecule only contains C, H, O, N, S, and P. You could do this manually, but it would take a while, so it makes sense to use a tool. I personally like this molecular formula calculator by ChemCalc. The input is straightforward: just enter the inferred exact mass and number of carbons (I usually allow for 1 either direction as wiggle room). The tool runs the calculations for you, and in most cases, the solution space is fairly narrow. For this peak, we end up with one possible molecular formula C6H12O6; see below in Figure 5. This is the formula for all hexose sugars, which we know are present in the sample (orange juice).
Summary
MS1 data represent m/z values and intensities for intact, non-fragmented ions generated from molecules in a biological sample. In this post, we explore how to identify molecules and ultimately derive molecular formulas from MS1 data.
We used the m/z difference between M+0 and M+1 signals to determine the charge, and the ratio of the intensity of M+1 to M+1 to determine the number of carbon atoms in the molecule. We then generalized the approach to using similar information to identify all elements in the molecule, if detectable in the spectrum. We realized that information on other elements might not always be available, but that the charge, monoisotopic mass, and number of carbon atoms is usually sufficient to infer the molecular formula of the compound.
For some applications, MS1-based identification provides sufficient information. However, in other cases, further experiments are necessary to confirm the compound’s identity. The next step could be injecting more sample to detect additional elements, further refining the possible molecular formulas. Beyond that, fragmentation (MS2) or comparing the observed data to chemical standards could provide definitive confirmation. We will explore these techniques in future posts.